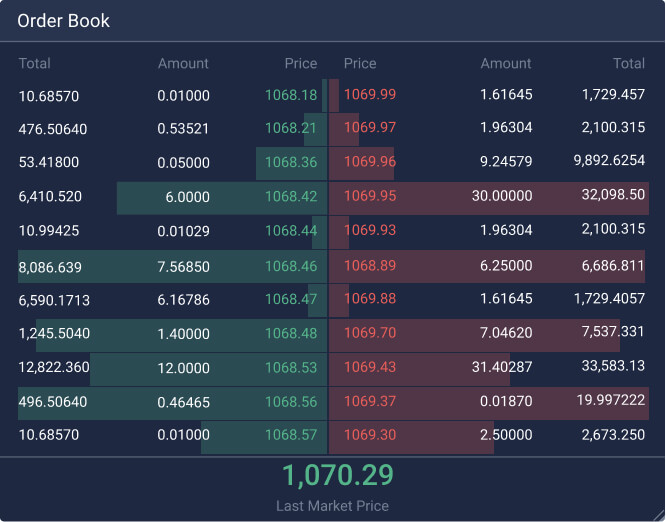
Options Bid/Ask Spreads For Weekly Expirations
This study was run out of need to filter options for liquidity. The base watchlist (array of symbols) was derived from TOS with a weekly option filter placed on it. Foreach symbol we went through and calculated what the bid/ask spread were on the 30 ∆ puts expiring one week from the “current” Friday each week. The data shows the average open, close (expiration) and 1 day before close (expiration). It was thought that one day before expiration may have increased liquidity from systems trying to catch trapped traders on expiration.
NOVEMBER 01, 2021
Put, Call and Strangle Selling Profitability
This study was run to find the profitability of weekly options selling on an array of symbols. These symbols were filtered for acceptable liquidity and risk tolerance thresholds based on theoretical account values between $100,000 and $500,000. Accounts above $500,000 may have possible liquidity issues that would adversely effect profitability. Accounts under $100,000 may have issues taking control of exercised options in certain symbols which was assumed in expirations with Bid/ Ask spreads above acceptable levels.
In this study we simulated selling a 30 ∆ call and put every Friday at the close for the next weekly expiration. In the event one of the options expired in the money, the shares were simulated to be exercised and the position immediately closed at the closing price on that expiration day. In practice this may not be possible, but was determined to be the best course of action for this study.
Trickle Down Options Symbols Correlations
This study was run to find possible correlations between the “Upper Symbols” and other symbols. Symbols with high correlations to these Upper Symbols would be expected to follow suit with any possible breakouts or breakdowns. These breakouts or breakdowns could lead to filtering of option selling to one side when a signal arises with the Upper Symbol.
All symbols included in the Trickle Down Watchlist were used in comparison for this study. The Upper Symbols were used based off preliminary hypothesis of valid Upper Symbols. Any symbols from the trickle down watchlist that did not have matching data counts with the Upper Symbols were left off.